Created by Silvie Cinková
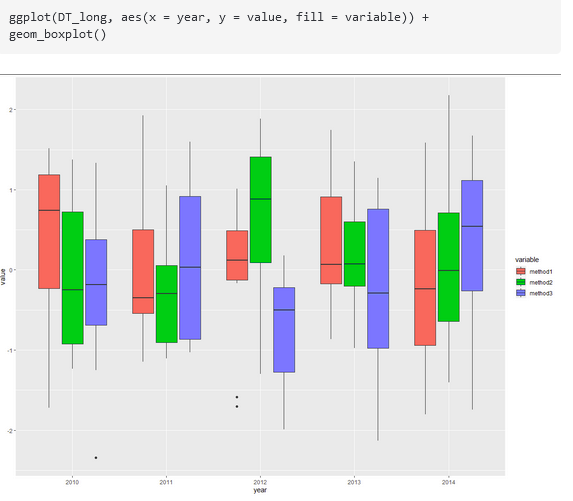
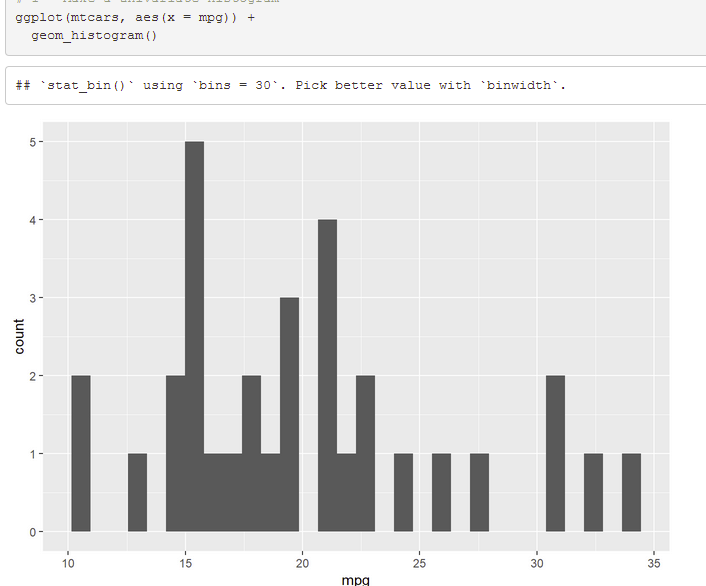
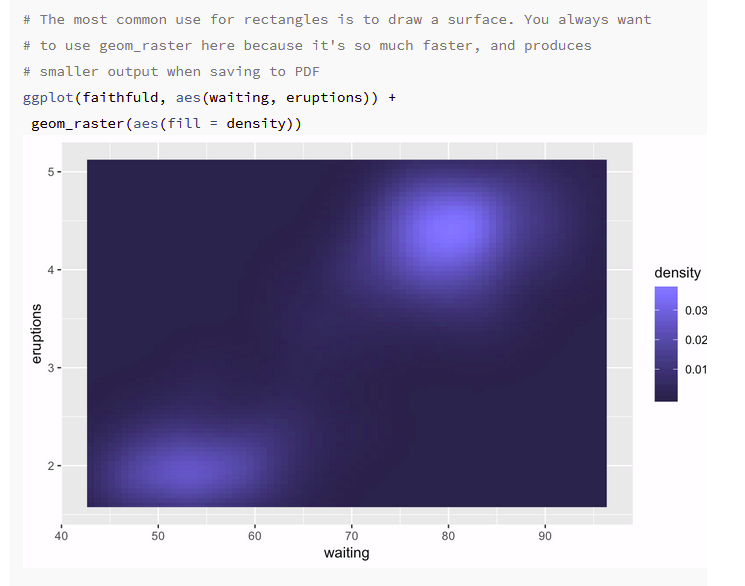
geom = geometric object
They control the type of plot you create.
Each geom has a set of aesthetics it understands, some of them are obligatory.
Every geom has a default statistic (and every statistic has a default geom).
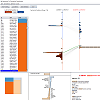
(IEEE PacificVis 2015 short paper)
TrustMLVis BrowserA Visual Survey in Enhancing Trust in Machine Learning (ML) Models with Visualization (CGF survey article) Provided by ISOVIS group
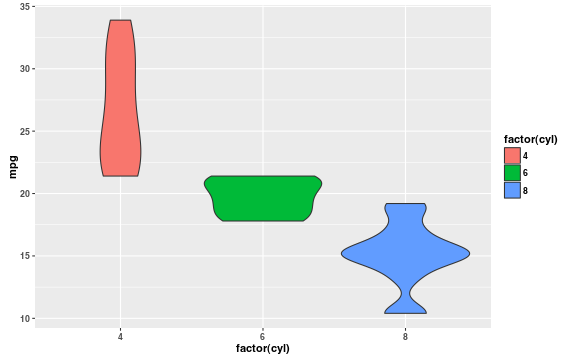
ggplot(mtcars,
aes(x = factor(cyl), y = mpg, fill = factor(cyl))) +
geom_violin()
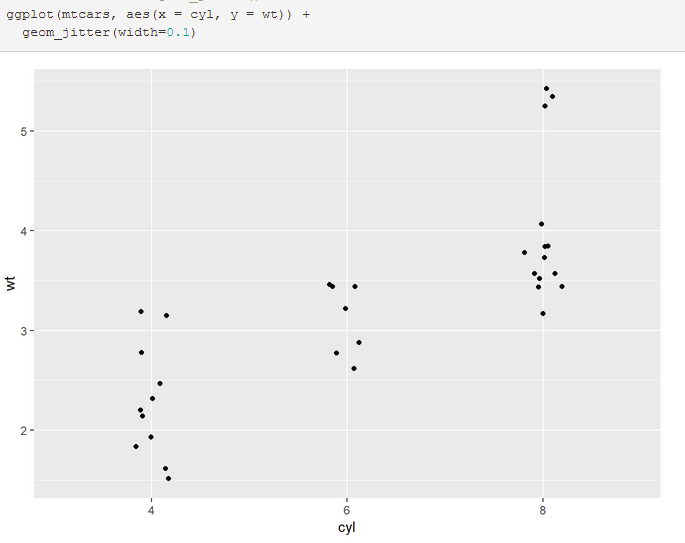
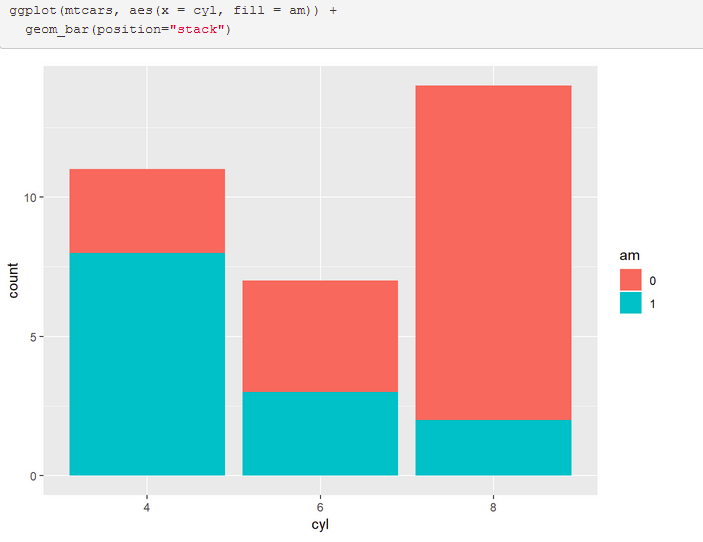
This parameter occurs only inside geoms, and not all of them.
it can have either a string value (look it up, but e.g. "jitter", "dodge", "stack", "fill"), or call a function from the family of
function_XXXX.
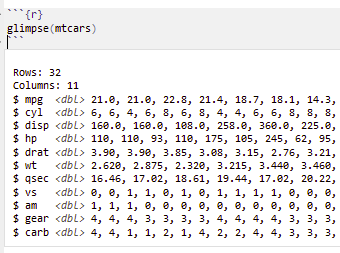
iris
iris %>% filter(Species == "setosa")
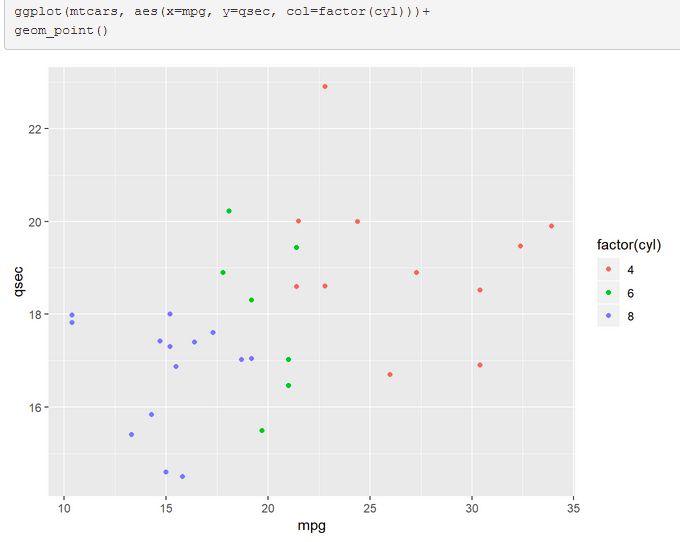
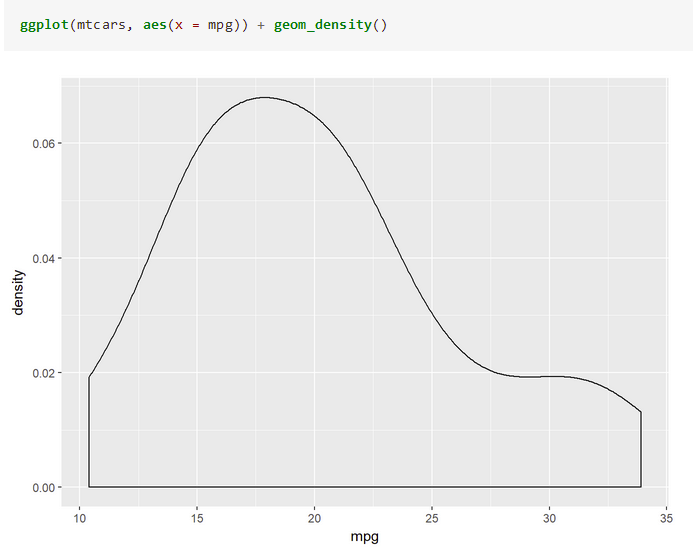
Each plot must have filled out the mappings parameter. It comes either directly into the initial ggplot() function, following the data parameter, or inside a geom_xxx() function.
The only possible value of the mappings parameter is the aes() function. In it, you map your variable on diverse aesthetic scales: